
TLDR: I penned this piece several days back but didn't get the time to publish it. But here we are a week later and Bitcoin has hammered up to 63k, establishing the very point I was making about BTC’s price elasticity!
We have to understand the broader context of Bitcoin's market dynamics and why it exhibits a much higher price elasticity to sell pressure than other assets. It’s not just the newness of the asset and its relatively lower liquidity, and we explore this in relation to stocks and gold, but also the technology and its impact on market opacity.
The recent collapse of Bitcoin (BTC) price under $57,000 for the first time since late April has sparked concerns on the health of not just Bitcoin but the entire crypto market. Several factors contributed to this drop, including the overhang of the distribution of assets from the defunct exchange Mt. Gox and potential miner sales. On Thursday, fears surrounding the impending release of Bitcoin from Mt. Gox triggered a 3.3% drop in BTC price within 24 hours. This selling pressure was further exacerbated by a significant liquidation of futures positions, where over $230 million in futures trades betting on higher prices were liquidated, causing a ripple effect across the crypto market.
Then followed the saga of the German government-seized BTC flowing into the market for liquidation. This led to BTC prices sliding down to $54,000 and causing much anguish, before now getting back to almost $58,000. Since 2023, total capital of $224 billion USD of BTC has flowed into the market, and government seized BTC contributes to about 9 billion, that is only about 4% of the total capital that has entered the market since 2023. So, the stats say a different story, the government stash entering the market supply is not a staggering quantum that imbalances the supply-demand equilibrium hugely in a shorter term.
Despite these concerns, it's important to consider the broader context of Bitcoin's market dynamics. Bitcoin exhibits a much higher price elasticity to sell pressure than other assets. And that’s something we need to understand in the context of not only the newness of the asset and liquidity, but also the technology and its impact on market opacity.
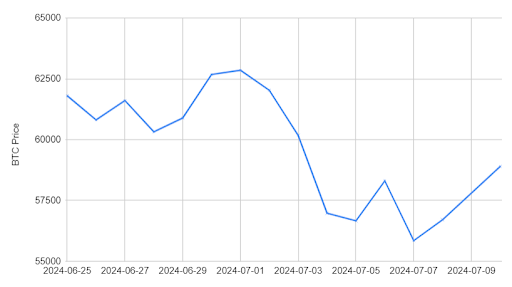
Figure 1: BTC Price for last 2 weeks
Comparing vs Stocks vs Gold
Large sales of stock by prominent investors often lead to significant price drops and market instability. This effect is particularly pronounced with Bitcoin, which exhibits a higher sensitivity to large transactions. To illustrate, let's compare Bitcoin’s price elasticity with notable examples from the stock market.
In 2017, Warren Buffett's Berkshire Hathaway sold about one-third of its stake in IBM, approximately 30 million shares, which led to a significant drop in IBM's stock price. This sell-off caused IBM's market capitalization to decrease by over $9 billion, and the stock price to fall more than 5% in pre-market trading. Given that IBM's average daily trading volume in early May 2017 was around 4.8 million shares, Buffett's sale represented approximately 6x of the average daily volume. This massive sell-off resulted in investor uncertainty and market volatility. Note that inspite of such a high sell off compared to daily volumes, IBM shares moved down by 5%, not even double digits.
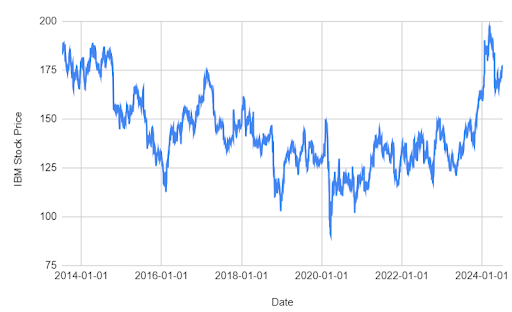
Figure 2: IBM price collapse
Similarly, In 2013, Carl Icahn revealed his significant stake in Netflix, causing the stock price to surge. He acquired shares at an average price of $58, and by late 2013, Netflix's stock had increased by 457%, reaching over $340 per share. In October 2013, Icahn sold about half of his stake, approximately 2.4 million shares, for around $819 million, resulting in a profit of $645 million. This sale led to a significant drop in Netflix's stock price by over 9%. In contrast, one can see Bitcoin and how high its price elasticity is even with small movements of market volume. Sentiments sway fast in the crypto markets and are yet to be naturalized to broader market statistics.
Comparing Bitcoin to gold provides further insights into price elasticity. Between 1999 and 2002, the United Kingdom sold approximately 395 tonnes of gold - an event that came to be known as the Brown Bottom. The announcement of the gold sales in May 1999 led to a significant drop in gold prices, falling from around $282 per ounce to about $252 per ounce, a 10% decrease, before the auctions even began. The initial announcement had an immediate and substantial impact on gold prices, indicating high short-term price elasticity.
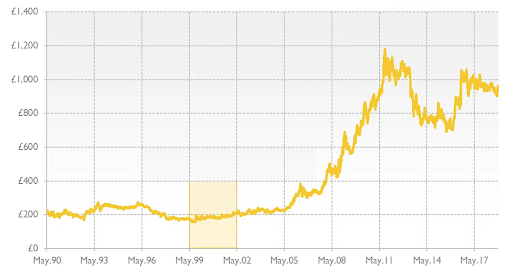
Figure 3: Gold Brown bottom and recovery
Similar to Bitcoin, the announcement of large-scale sales had an immediate impact on gold prices due to increased visibility and market expectations. However, the overall impact on gold was more contained, reflecting lower overall price elasticity. Gold’s well-established market structure and deeper liquidity helped absorb the increased supply over time. Institutional involvement and hedging mechanisms also played roles in stabilizing prices post-sales. High short-term price elasticity can lead to exaggerated downward price movements, but as an asset class or a particular asset matures, attains liquidity depth, and sentiment stability, its price elasticity reduces. Short term price impacts are not market indicative.
Opacity and Blockchain Transparency
Blockchain transparency significantly influences Bitcoin's price sensitivity, making the cryptocurrency market uniquely responsive to large transactions.
The lack of opacity in blockchain markets means that as all transactions are recorded on a public ledger, anyone can observe large movements of BTC, such as those from dormant wallets to exchanges, which often signal potential selling pressure. Due to this transparency, the market can react swiftly to anticipated sell-offs, and this triggers a domino effect, resulting in an overreaction. Immediate identification of large volumes moving to exchanges can lead to preemptive selling by market participants, increasing the sell pressure and ultimately exerting price pressure. volatility.
Services and platforms that track whale movements provide additional transparency. When significant amounts of BTC move, these alerts can influence market sentiment and trading behavior. While blockchain provides a high level of transparency, allowing market participants to see large movements and react accordingly, this can lead to increased volatility as traders preemptively respond to perceived selling pressure. In contrast, traditional stock markets have mechanisms to mask large trades to some extent, reducing immediate market reactions and contributing to greater stability. The lack of opacity increases Bitcoin’s price elasticity substantially. Opacity has been a feature of financial markets, and when we have a new asset class like Bitcoin and crypto which have easily accessible transaction transparency that takes away opacity, markets need to readjust to this paradigm
Bitcoin's Market Maturity
Unlike traditional assets, Bitcoin's market is still relatively young and less mature, contributing to inherent volatility, and exacerbated by Bitcoin’s limited liquidity compared to more established markets like equities or forex. For instance, In the fourth quarter of 2023, Bitcoin's average daily trading volume was around $18 billion, compared to Nasdaq’s average of $63.75 billion and the European Stock Exchanges' average of $69.5 billion. This disparity in liquidity means that equivalent sell orders have a more pronounced impact on Bitcoin prices.
Currently, Bitcoin's elasticity is amplified by various factors, including regulatory developments, technological changes, and the evolving landscape of institutional involvement. The regulatory environment can quickly alter market perceptions, while technological advancements or network upgrades can lead to sharp price adjustments. Moreover, the increasing participation of institutional investors, who tend to execute larger trades, can magnify price movements. However, this heightened elasticity is not a permanent feature. As the market matures, liquidity improves, and regulatory frameworks stabilize, Bitcoin's price elasticity is expected to align more closely with traditional market norms. And we can already see the decreasing volatility trend in Bitcoin.
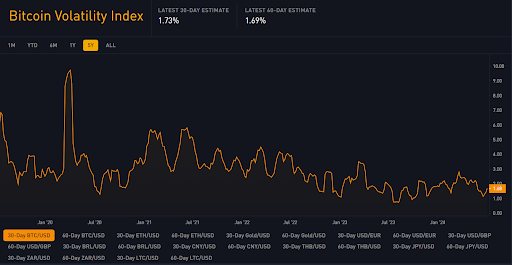
Figure 4: BTC-USD 30 day volatility index
As the market evolves and matures, the elasticity of Bitcoin prices will decrease, leading to more stable and predictable price behavior akin to that of traditional financial assets. This anticipated stabilization suggests that the current heightened sensitivity to selling pressure is a transient phase in Bitcoin's market development. Historical data supports this trend, showing a gradual decrease in Bitcoin’s volatility over the years.
| Year | Average 30-Day BTC/USD Volatility |
|---|---|
| 2010 | 6.21% |
| 2011 | 8.26% |
| 2012 | 4.50% |
| 2013 | 5.50% |
| 2014 | 5.06% |
| 2015 | 4.26% |
| 2016 | 2.49% |
| 2017 | 4.13% |
| 2018 | 4.58% |
| 2019 | 4.06% |
| 2020 | 5.17% |
| 2021 | 4.56% |
Bitcoin’s average 30-day volatility has generally decreased over time, suggesting a trend towards greater market stability. For instance, the average volatility of Bitcoin in 2021 was 4.56%, significantly lower than in 2011 when it was 8.26%. This trend supports the view that Bitcoin's market is gradually maturing, leading to reduced price volatility.
>The unique characteristics of the cryptocurrency market - lower liquidity, higher volatility, continuous trading, and transparency exacerbate its over-sensitivity to large transactions. Bitcoin itself has probably undergone a change from being largely a mode of payment (by design), to more a store of value. Understanding these differences is crucial to decipher the high price elasticity of Bitcoin, and to recognize that this high price elasticity is not reflective of the fundamentals of this amazing new financial product which one day could be the reserve currency of the world, or the basis of a universally accepted, sovereign independent, inflation resistant asset that backs global transactions and wealth reserves. So, just HODL.